Inaugural Edition: Weekly COVID-19 Lab Testing Insights from hc1
INDIANAPOLIS, IN / AGILITYPR.NEWS / September 03, 2020 / Weekly COVID-19 Lab Testing Insights from hc1
Positive Antibody Serology and Viral PCR Tests Hold Steady
The CV19 Lab Testing Dashboard™ powered by hc1 provides local lab testing insights that include state, county, and sub-county views of Local Risk Index, COVID-19 testing rates and results, and key demographic filters for those tested (age, gender). Data used in the dashboard comes from more than 20,000 lab ordering locations from a coalition of laboratories performing up to 40 percent of the nation’s laboratory testing.
Summary
- Percent positivity rate for Viral PCR testing remains at about 5%.
- Percent positivity rate for Antibody Serology testing remains at about 12%.
- Counties from 1 new state make the hc1 Local Risk Index Top Counties for the week.
- To access the hc1 CV19 Lab Testing Dashboard, register for free at www.CV19Dashboard.org.
Viral PCR Testing
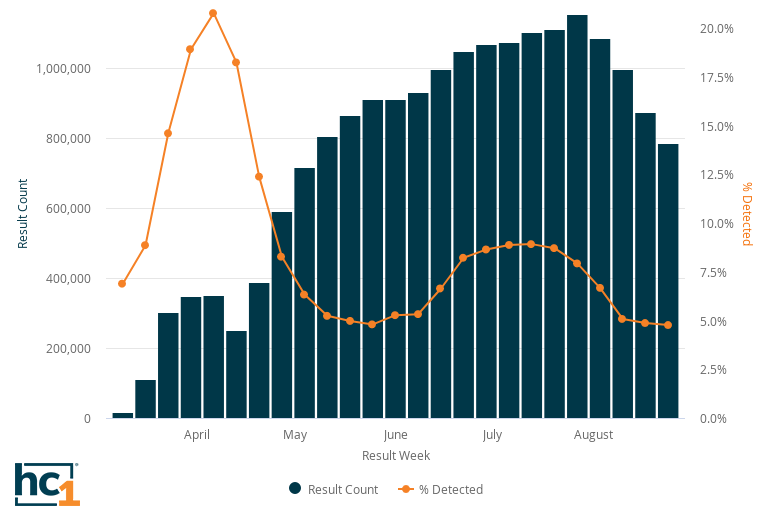
As of September 3, 2020, the national percent positivity rate for COVID-19 testing remained steady for a third consecutive week at about 5%. This can be seen in the following chart showing the weekly national trend in SARS-CoV-2 Viral PCR testing volume and % detected rate among the hc1 CV19 Coalition of Laboratories, which represents approximately 40% of all CV19 testing nationwide. Data also shows that overall testing volume continued to decrease during the final week of August.
Antibody Serology Testing
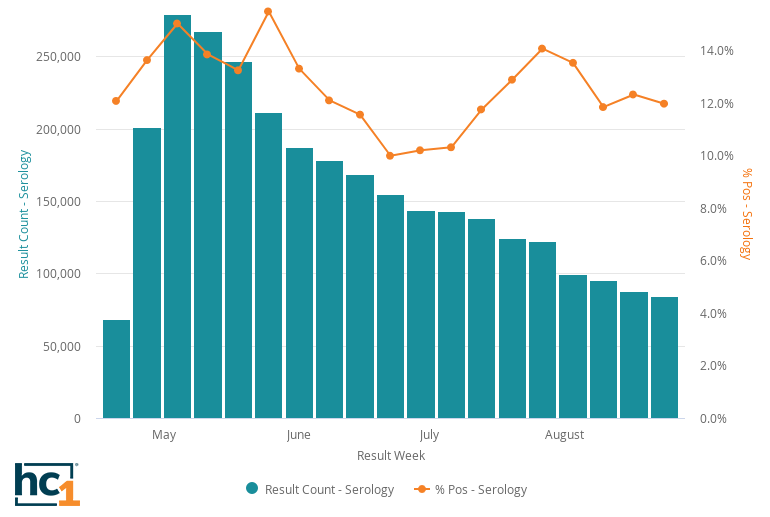
During this same timeframe, the weekly national trend in SARS-CoV-2 Antibody Serology testing volume and % detected rate continues to decrease and remains low in comparison to viral testing volume. Percent positivity remained the same at ~12%, as seen in the following chart, which also indicates a continued decline in the volume of antibody testing.
Local Risk Index
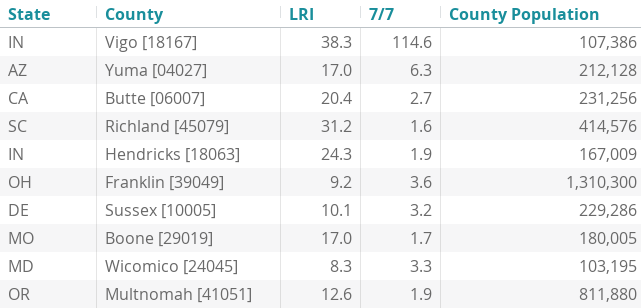
The hc1 Local Risk Index trends for the week of August 31, 2020 shows rising risk for infection in some states, including South Carolina and Indiana. This week the Top 10 Counties with the largest magnitude of change in infection rates from over last week, as determined by calculating the LRI x ‘7vs7’ rate* included just one repeat state, Missouri, with the remaining top counties located in Arizona, California, Delaware, Maryland, Ohio, and Oregon. (Dr. Peter Plantes offers deeper insights into each week’s hc1 Local Risk Index Top Counties here: https://www.hc1.com/blog/tag/covid-19/.)
Criteria for Top Counties:
- A population greater than 100,000
- More than 100 COVID-19 viral tests performed in the past week
- An hc1 Local Risk Index™ greater than 7
- An acceleration factor of LRI equal to or greater than 1.5
For a community of 100,000, a rapid rise in the presence of positive COVID-19 viral testing is the earliest indicator that ER, hospital, ICU, ventilators, and other medical resources (clinical providers, PPE, facilities, etc.) will be heavily taxed in the next 10 to 21 days. The community that has the largest acceleration in positive tests week-over-week will see the fastest rise in the magnitude of COVID-19 cases.
* This brief video provides an explanation of how to utilize the LRI to track specific regions.
Contacts